Biogenity | Interactive Pathways
Introduction
Explore your omics data with Biogenity’s interactive pathway-finder. These plots have been compiled using the data obtained from your experimental data and the two knowledge databases, Gene Ontology (GO) and Reactome.
Navigation:
On the left navigation menu, you see the top 30 Reactome pathways ranked by the adjusted p-value. We recommend using the navigation menu to find the comparison of interest instead of scrolling when navigating between the group comparisons. It typically provides a better user experience.
Click on the pathway you like to examine in the navigation.
You can also use keyboard shortcuts:
- Left/Right arrow to go back and forth between plots
- S key to show/hide navigation menu
Plots:
The round nodes are a colored gradient based on the log2 fold change between the two groups. The lowest log2 fold observations are colored red, the mean value is yellow, and the highest is green. The blue nodes are proteins in the pathway that were not detected in the experiment.
- Low log2 fold
- Mean log2 fold
- High log2 fold
- Not detected
The p-values and log2 fold change values can be inspected by mousing over a node containing the associated UniProt ID and common gene name.
There are four types of lines connecting the nodes, colored by the effect of the protein interaction. Activation is green, inhibition is red, binding is blue, and processes are orange.
- Activation
- Inhibition
- Binding
- Processes
If the direction of the effect is known, the lines will have a colored arrow to indicate this.
- Activation
- Inhibition
- Processes
In the menu for the plot, you can isolate a specific protein of interest by clicking the UniProt ID in the dropdown.
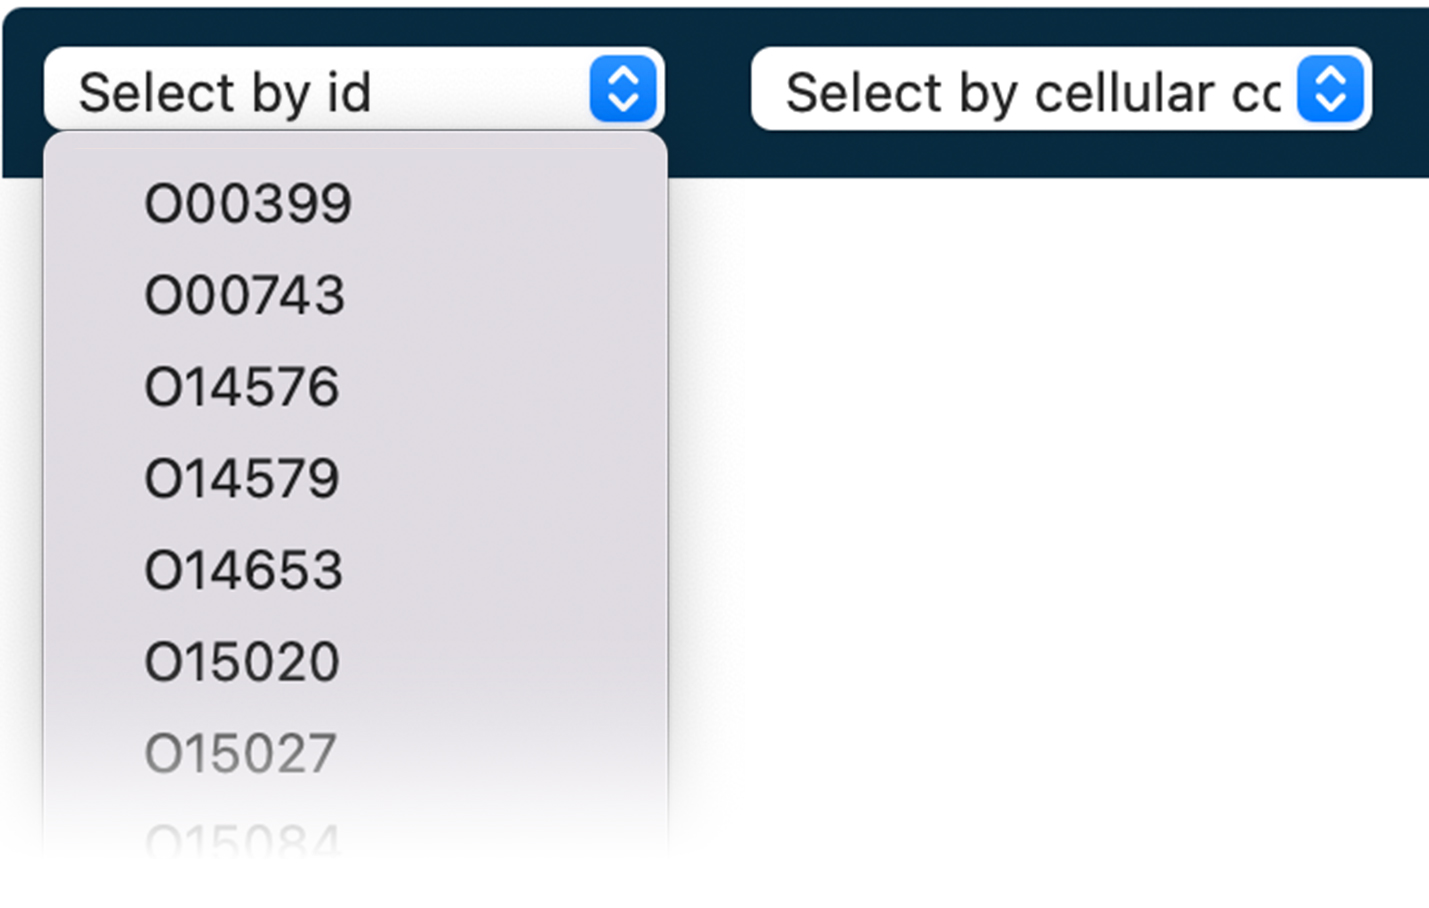
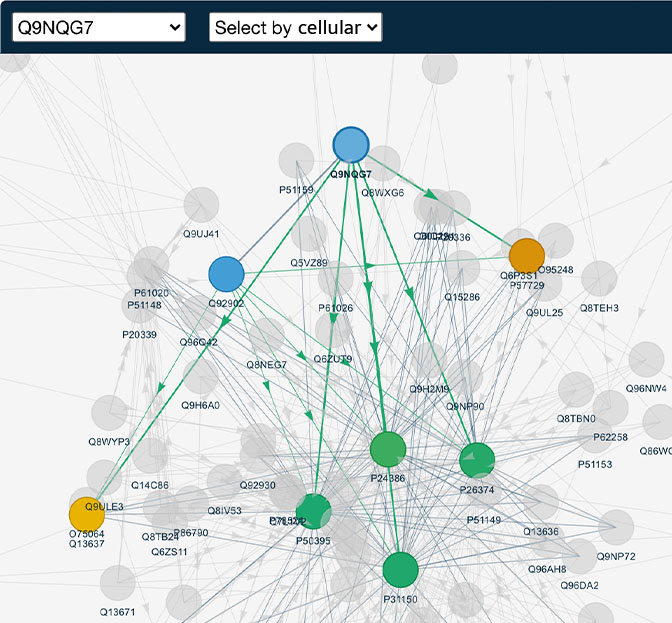
This highlights the proteins that are connected to the protein of interest. All grayed-out nodes show proteins that do not interact with your selection. You can achieve the same by clicking a specific node.
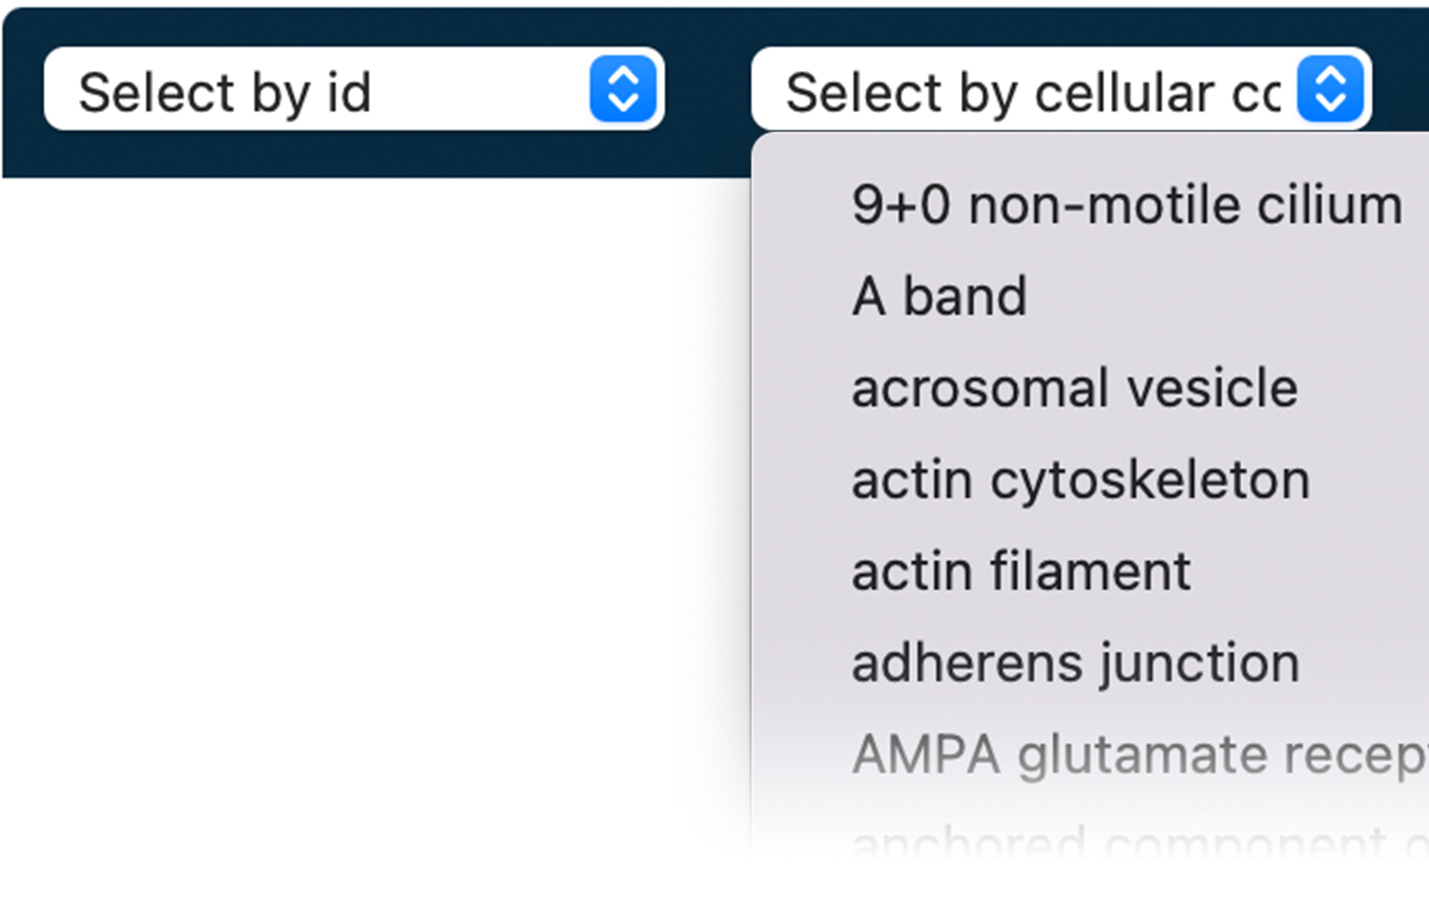
You can select gene ontology terms of interest with the other dropdown menu. This highlights the proteins associated with the chosen term, e.g., actin filament.
You can zoom by scrolling and rearrange by dragging each node as you please. Please be aware that any changes will not be saved if you reload the page, including clicking on other plots in the navigation.
We'd love to hear your feedback
We are constantly working to improve our interactive plot, so we are very interested in your feedback. Both on how you use the plot, any suggestions for improvements, or new features. We look forward to hearing from you: feedback@biogenity.com